
The Setup
The stock market is a predictive instrument. It skates where the puck is going, not where it is right now.
Technical indicators suggest ADBE is aiming to extend the 56% rally that started last May to better reflect its prospects as an AI-beneficiary, no longer encumbered by a costly acquisition (Figma). In May, three indicators – MACD, 50d SMA, and 90d SMA – were instrumental. Those same three indicators are beginning to show bullish signs.
Ideally, this how the trade unfolds:
- ADBE bounces off the 90d SMA.
- After more than a month in bearish territory, MACD experiences a bullish crossover.
- A successful test of the 50d SMA catalyzes a breakout, taking out resistance at $630.
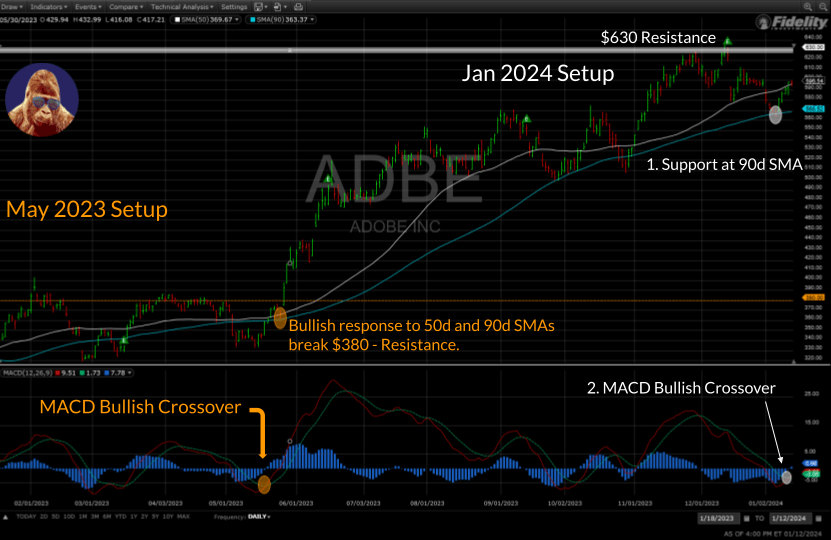
With the first two steps complete, the stage is set for a bullish move off the 50d SMA to challenge resistance at $630. Once that resistance level is broken, the path to $680 is clear.
The Trade
The technicals provide a path for ADBE to reach $670 – $680 before the mid-March earnings.
Assuming entry at $595, a $675 exit presents a 13.5% upside over two months. On the downside, the stock’s behavior since September showcases the 90d SMA as major support.
Failure to maintain it means a bearish shift in sentiment. Exiting with a close below the 90d SMA around ~$570 establishes a 4% stop-loss.
13.5% upside; 4% downside; 2 month time period. Not bad.
Not An Investment
This opportunity is meant to be a trade, not an investment, with a two month time horizon concluding with their earnings report. The report, which is expected after the market closes on March 14th, has the power to suddenly and significantly alter the technicals. While this is not my base case for ADBE, it did happen to Oracle (ORCL) after a lackluster September report.

Consequently, this opportunity expires with a close below the 90d SMA or at 3:59PM the session before their earnings report, whichever comes first, because the analysis – upside/downside targets, technical formations – would be stale.

Leave a Reply