
Weekly Performance
| S&P 500 | 1.84% |
| Equal Weight S&P 500 (RSP) | 0.25% |
| NASDAQ | 3.09% |
| DOW | 0.34% |
| Russell 2000 (VTWO) | -0.01% |
Talk of the Tape
A resilient response to CPI showed stocks can handle inflationary data so long as the “trend is our friend”. The following day, PPI, a leading indicator for inflation, was cool, supporting that friendly notion. Excluding J.P. Morgan, the money center banks’ results failed to impress. Net-net, their commentary left a slightly bearish hint for upcoming earnings.
The Week Ahead
| Monday | Tuesday | Wednesday | Thursday | Friday |
|---|---|---|---|---|
| Market is closed: MLK Day | *Goldman Sachs (GS) *Morgan Stanley (MS) | U.S. Retail Sales Fed Beige Book | Housing Starts Building Permits KeyCorp (KEY) | Comerica (CMA) Fifth Third (FITB) |
Macro Movers
U.S. Retail Sales: After some mixed signals from bank earnings, I hope this report provides some evidence for consumer optimism. However, an oversized upside beat could stoke inflation concerns, which would be bad for stocks. The headline estimate is 0.4%; minus autos the consensus is 0.2%. Ideally, the outcome is close to consensus.
Fed Beige Book: Ideally, this qualitative summary of economic conditions from the 12 Federal Reserves Districts provides dovish support to relax inflation concerns surrounding the wage number Payrolls reported earlier in the month.
Housing Starts & Building Permits: Expectations for housing starts are 1.43 million; for building permits, the forecast stands at 1.48 million. The larger the beat, the better. Despite the widespread understanding that housing inflation metrics lag, housing costs are inarguably high. Perhaps if it becomes clear that more housing supply is in the pipeline, indicating future cost declines, market participants — most importantly the Fed — may take a nuanced view on this component of inflation.
Micro Movers
Goldman Sachs and Morgan Stanley aside, which I expect to deliver solid quarters due to Citi’s investment banking performance, several regional banks are reporting this week. Regardless of your thoughts on the regionals, it must be acknowledged that their performance is integral to the “broadening out” trade.
This trade stipulates investors take profit in the Magnificent Seven to pursue opportunities in other parts of the market with greater short-to-intermediate term upside.
The Russell 2000, a small-cap index poised to benefit handsomely from that trade, is 16% financials. A meaningful portion of the index is reporting, making it an integral period for this trade, which I believe offers the healthiest path to a more durable bull market with higher stock prices.
Best case scenario: the regional banks advance markedly, pulling the Russell 2000 up with it, causing investors to double down on the “broadening out” trade, creating new market winners.
Worst case scenario: the regional banks meaningfully decline, pulling the Russell 2000 down with it, causing investors to reconsider the “broadening out” trade, tempting investors to fall back on the Magnificent Seven.
In the event the regionals have a flat earnings period, it’s a push.
Gorilla Tactics: Adobe (ADBE)
The Setup
The stock market is a predictive instrument. It skates where the puck is going, not where it is right now.
Technical indicators suggest ADBE is aiming to extend the 56% rally that started last May to better reflect its prospects as an AI-beneficiary, no longer encumbered by a costly acquisition (Figma). In May, three indicators – MACD, 50d SMA, and 90d SMA – were instrumental. Those same three indicators are beginning to show bullish signs.
Ideally, this how the trade unfolds:
- ADBE bounces off the 90d SMA.
- After more than a month in bearish territory, MACD experiences a bullish crossover.
- A successful test of the 50d SMA catalyzes a breakout, taking out resistance at $630.
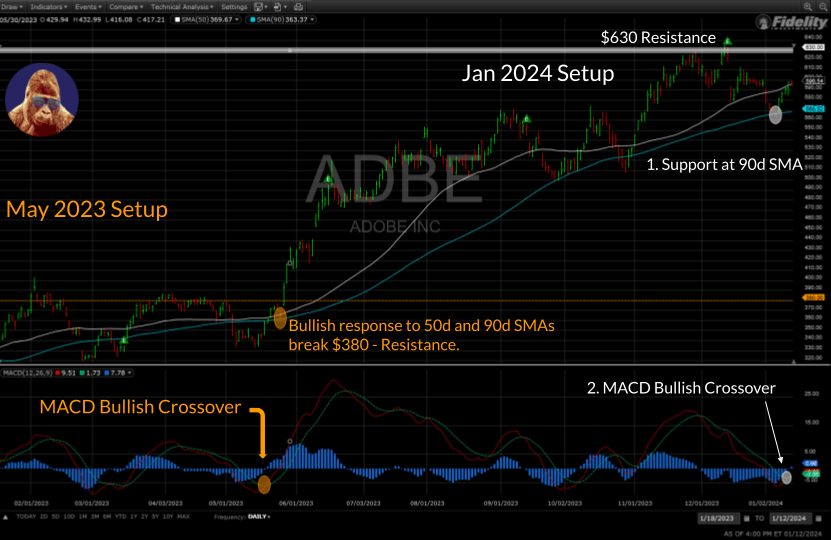
With the first two steps complete, the stage is set for a bullish move off the 50d SMA to challenge resistance at $630. Once that resistance level is broken, the path to $680 is clear.
The Trade
The technicals provide a path for ADBE to reach $670 – $680 before the mid-March earnings.
Assuming entry at $595, a $675 exit presents a 13.5% upside over two months.
On the downside, the stock’s behavior since September showcases the 90d SMA as major support. Failure to maintain it means a bearish shift in sentiment. Exiting with a close below the 90d SMA around ~$570 establishes a 4% stop-loss.
13.5% upside; 4% downside; 2 month time period. Not bad.
Not An Investment
This opportunity is meant to be a trade, not an investment, with a two month time horizon concluding with their earnings report. The report, which is expected after the market closes on March 14th, has the power to suddenly and significantly alter the technicals. While this is not my base case for ADBE, it happened to Oracle (ORCL) twice after lackluster quarterly reports.

Consequently, this opportunity expires with a close below the 90d SMA or at 3:59PM the session before their earnings report, whichever comes first, because the analysis – upside/downside targets, technical formations – would be stale.

Leave a Reply