
The Week Behind
In the latter part of the week, WTI and the US10Y eased from their peaks, allowing stocks to bounce off oversold conditions. Although this week’s performance wasn’t impressive, it feels like the three-week sell-off has lost momentum. The Dow declined by 1.3%, the S&P 500 fell by 0.74%, and the NASDAQ managed to eke out a small 0.06% gain.
Highlights
- Costco reported a “business-as-usual” quarter, along with some positive inflation commentary.
- Carnival’s quarter was better than recent indications from airline operators would suggest, contradicting the notion of a negative inflection in consumer health.
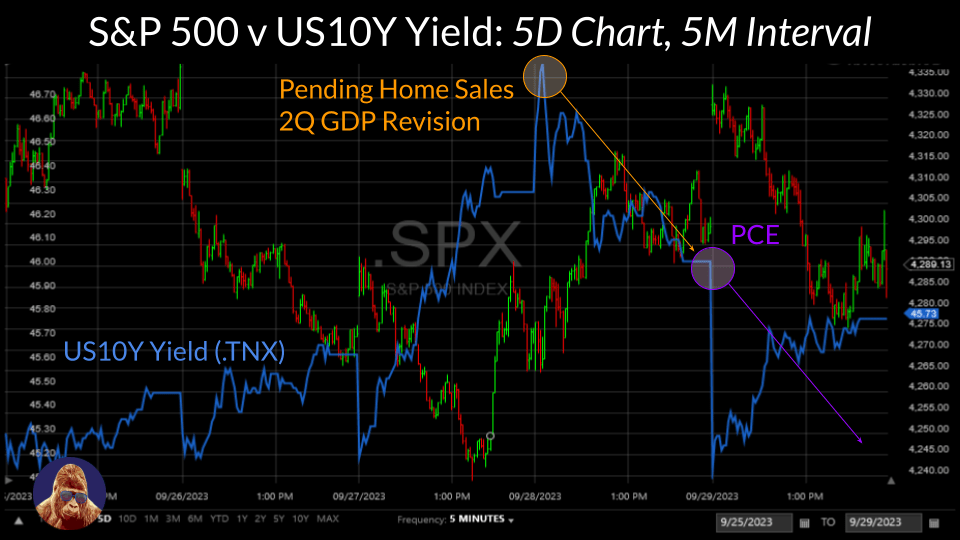
- Pending home sales was the worst since last October: -7.1% actual v. -1.0% estimate.
- 2Q GDP was revised to 2.1%, falling below the 2.2% projection.
- Year-over-year Core PCE met the 3.9% forecast, marking the first sub-4% reading this cycle. On a monthly basis, core stood at 0.1%, below the 0.2% consensus estimate.
A Buildable Bounce
At the beginning of last week, the S&P 500 was ~7% off the high. Both WTI and the US10Y appeared on relentless upward trajectories, sentiment had overwhelmingly turned bearish, and multiple technical indicators indicated that stocks were oversold.
When things get that bad, all it takes is a little good news to attract speculators looking to trade a bullish bounce.
That good news arrived on Thursday: pending home sales registered the lowest reading in nearly a year, and the 2Q GDP revision was soft. Both support the case for the Fed to maintain its current interest rate pause. As financial markets processed these reports, yields across the curve began to retreat, providing a much-needed breather for stocks.
Following a rapid 5-7% downturn within a short period, it seems as though some shorts decided to take profits and cover at the first sign that the US10Y trade might become more balanced. Once short-term traders recognized shorts had paused their assault, many initiated long positions to play the bounce. This rush of buying from short-covering and new long positions allowed the S&P 500 to rebound from the $4250 level.
Can the market build off of this bounce?
Many rallies begin with a short covering. A rally’s endurance depends on how well the rally can force late shorts to cover and attract new buyers to enter. My characterization of the US10Y as the market’s guiding star has not changed: The more its yield declines, the more likely that shorts cover and longs enter.
The level to watch is 4.35%. In my view, PCE was a positive outcome for interest rate doves and stock bulls. However, by the close, the US10Y yield had largely recovered from the downside PCE caused, indicating that the issue is far from settled.
The Week Ahead
There are ~2 weeks to go before the final earnings season of 2023. Until then, I anticipate the market will remain focused on macroeconomic factors. This week, the spotlight will be on the job market and wage inflation.
On Wednesday, the ADP employment survey for September will be released. The private market survey is expected to show 150k jobs were created, less than the prior month’s 177k. Beyond the headline figure, the ADP survey also provides insights into wage trends, particularly the comparison between pay growth for job changers and “job stayers”.
Then, on Friday before the market opens, the nonfarm payrolls report will be published. Headline job creation is forecasted at 170k, implying contraction from 187k prior. Unemployment, which last month was 3.8%, is projected to decrease by 0.1%. In terms of hourly wages, the consensus estimates stand at 4.3% on a yearly basis and 0.3% on a monthly basis.
Ideally, these labor reports will surprise on the downside. Such an outcome would offer evidence to the Fed that wage and services inflation are not behaving in a manner that requires incrementally tighter monetary policy. To gauge market reactions to these reports, keep a close eye on the yields of the US2Y and US10Y. Consider the reports as bullish if yields decline in response, and bearish if yields move in the opposite direction.
Wake Up! September has Ended
Seasonality has been the winning playbook this year. Stocks reached their peak in July, the strongest historical month on average, just before the seasonal misgivings of August and September. Those who sold in July managed to sidestep the 7% decline in the S&P 500 that started as soon as August arrived.
From my perspective, macroeconomic cross-currents have created such a balanced economic debate that conviction is in short supply. Long investors must grapple with the competition posed by bond yields, while short investors must consider the possibility that the Fed’s tightening cycle is complete. In an environment where conviction is in short supply, investors often turn to technical analysis and seasonality because these strategies offer the credibility of statistics and history.
Despite October’s negative reputation, seasonality looks favorably upon the month. Some of the most infamous stock market crashes occurred in October:
- Panic of 1907
- Black Tuesday, 1929
- Black Thursday, 1929
- Black Monday, 1929
- Black Monday, 1987
However, there have been more positive months for the S&P in October than in September. History reveals that October has signaled the end of more bear markets than it has marked the beginning of new ones. If this new bull market holds, then the 2022 bear market will also have concluded in October.
Considering the remarkable success of seasonality this year, I expect October to be a promising month for equities. The upcoming earnings season should divert attention away from inflation and interest rates, fostering a potential shift in sentiment that has been overly focused on the negative aspects and somewhat neglectful of the positive ones.


Leave a Reply