
The Week Behind
Despite July Payrolls relaxing interest rates, stocks faded halfway through Friday’s session. While there is no clear consensus on the downside catalyst, I suspect the 5% post-earnings decline in Apple shares played a role. As a result, all major indices ended the week lower: the Dow down 1.11%, the S&P 500 down 2.27%, and the NASDAQ down 2.85%.
Highlights
- Fitch’s surprise downgrade of the U.S. credit rating led to a spike in yields, causing stocks to sell-off on Wednesday.
- ADP employment easily exceeded forecasts for a second consecutive month, but the market’s reaction was muted, likely waiting for Payrolls.
- Despite monthly average hourly wages coming in 0.1% stronger than anticipated, interest rates fell as solace was taken in a consecutive miss on headline job creation – 187k actual versus 200k estimated – counterbalancing inflationary concerns.
- Amazon delivered investors a 10% gain off a blowout quarter characterized by better-than-feared AWS growth, improving retail margins, and cost-cutting.
Charts: S&P 500 Momentum
A widely-used short-term momentum indicator involves monitoring crossovers between the 5-day and 13-day exponential moving averages (EMA):
- A bullish crossover occurs when the 5-day EMA penetrates and slopes upward through the 13-day EMA, signaling a shift in momentum in favor of the bulls, which serves as a buy-signal.
- A bearish crossover occurs when the 13-day EMA penetrates and slopes downward through the 5-day EMA, indicating a shift in momentum in favor of the bears, which serves as a sell-signal.
- Personally, I look for at least three sessions of sustained crossover to confirm the signal.
So far in 2023, the S&P 500 experienced four confirmed 5-13 day EMA crossovers: 3 bullish and 1 bearish. By following these crossovers and their associated buy and sell signals, traders could have made two profitable trades and avoided being misled by the volatility that occurred as April became May (gray area).
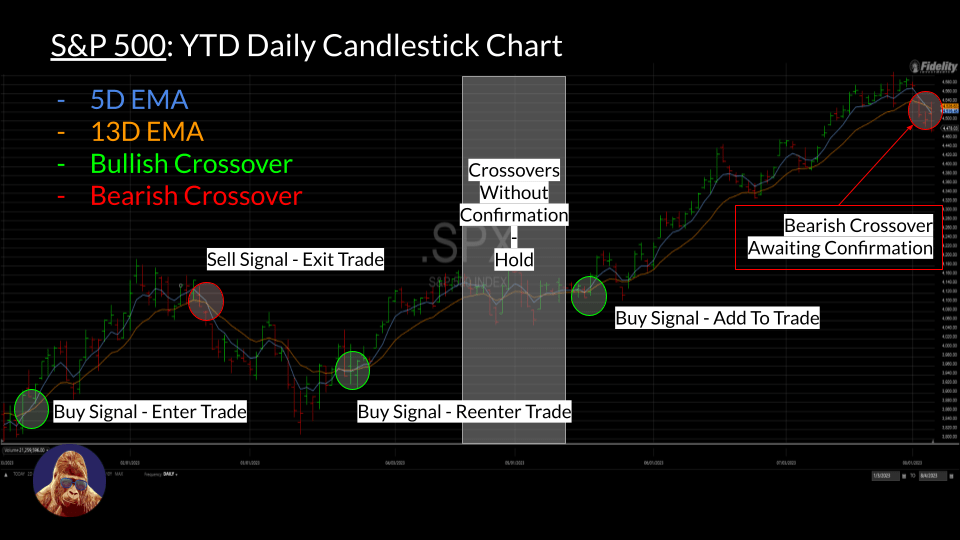
Currently, we are just two trading sessions away from a new bearish 5-13 day EMA crossover registering on the S&P 500. This would signify a loss of bullish momentum in the index. For traders, it suggests closing short-term S&P 500 trades. For investors, it presents an opportune time to take profits and prepare for potential downside in the near term.
It’s important to note that this indicator is short-term in nature and can register frequently. As such, it is better suited for managing trades rather than making long-term investment decisions. However, regardless of the time horizon, this indicator can help shape realistic market expectations, which keeps emotion in-check, thus reducing the likelihood of making impulsive, emotion-driven portfolio decisions.
The Week Ahead
Despite a week loaded with earnings reports, now that the most influential companies have already reported, the focus will shift to incoming inflation data through CPI and PPI.
On Thursday, July CPI will be released. Expectations for headline and core (year-over-year) are 3.3% and 4.7%, respectively. There is speculation that Headline CPI may surprise with a 2-handle, marking the first sub-3% inflation reading in more than 2 years, which would undoubtedly generate meaningful optimism. However, it should be remembered that the Fed has emphasized its prioritization of core metrics.
PPI, a leading indicator for inflation, holds predictive value for CPI, a lagging indicator. PPI is expected to increase by 0.2% MoM. A sub-0.2% result implies future downside for CPI; above 0.2% suggests the opposite. Soft CPI and PPI readings would indicate to the Fed that monetary policy is adequate to rein in inflation and reduce the probability of additional tightening.
On the earnings front, Eli Lilly has my undivided attention. With the XLV down ~2.25% year-to-date, it is fair to say healthcare has had a challenging 2023. However, LLY has outperformed its peers, rising ~23% over the same period, by distinguishing itself as a premier player in both Alzheimer’s and weight loss. If LLY’s stock trades down after earnings without a material change to their outlook, it could present an opportunity to invest in what I believe is still an underappreciated secular growth story attached to an unfathomably massive addressable market.
Charts: AAPL Support Levels
I believe weakness in Apple (AAPL) could be a plausible explanation for Friday’s sell-off. AAPL holds a crucial position as the largest company in the S&P 500 and one of the most widely-held in portfolios. Given its significant impact on the S&P 500’s performance and overall investor sentiment, if AAPL enters free-fall, the resulting selling pressure would likely be too much for the S&P 500 to maintain its current levels. AAPL’s 5% post-earnings decline has contributed to a potential bearish shift in the S&P 500’s short-term momentum. To counter this shift and sustain current levels, AAPL needs to stabilize. Thus, monitoring support levels in AAPL’s chart is crucial at this time.
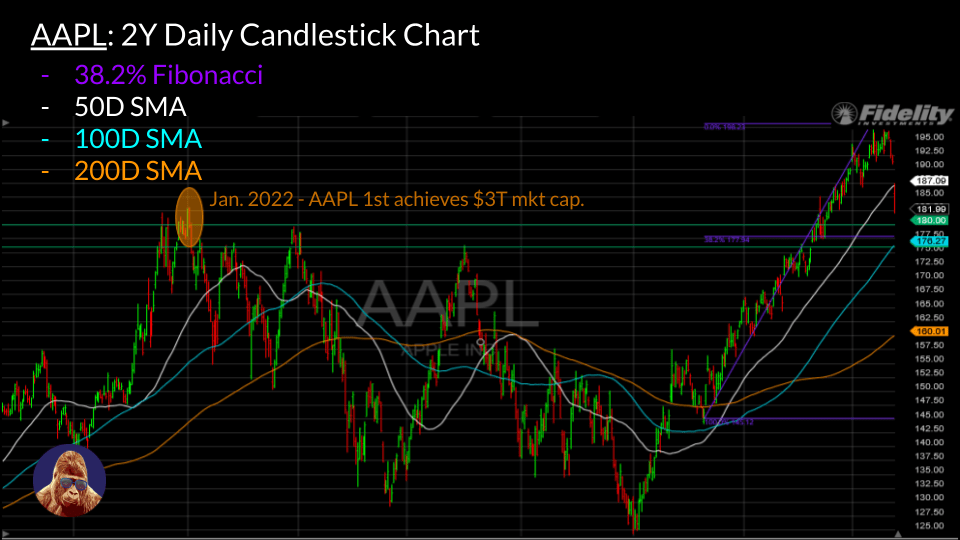
The $176-$180 range appears to be a critical support area, supported by a confluence of important price levels over various time-periods. These levels consist of the price points reached when first attaining ~$3T (top green line), intermediate highs during the 2022 bear market (bottom green line), a 38.2% Fibonacci Retracement Level (purple) of the recent rally, and the 100d SMA (light blue). Should AAPL be unable to secure support within this range, the resulting selling pressure could intensify, likely leading to further S&P 500 weakness.
For the next few weeks, at a minimum, AAPL’s performance will be critical in determining S&P 500 stability and direction. Personally, I am taking a cautious approach and waiting for AAPL to find solid support and show signs of reestablishing positive momentum before deploying new capital in equities.
Aside, Tuesday is the start of a two-week vacation. While I may publish the occasional note during that period, the brief will be on a two-week hiatus. I appreciate all of you that take time out of your day to read my work. I look forward to picking things up at 9:25 on 8/28.

Leave a Reply