
The Week Behind
The FED used September’s FOMC Meeting to showcase their determination to beat inflation by any means necessary, even if it requires bringing on and enduring a recession and sacrificing their co-mandate of full-employment. With no relief for markets, a retest of June’s lows was initiated. The DOW failed its retest, closing ~200 points below its June low of ~29,888 at ~29,590, ending the week 4% lighter. The S&P500 came within 15 points of its June low before rallying at the close. While the S&P500 passed its first retest, it ended the week 4.65% lower. While the NASDAQ remains ~300 points above its June low, it was the largest underperformer with respect to the majors, closing ~5% in the red.
- The FED delivered a third consecutive 75bp hike, bringing the FED Funds Rate to 3-3.25%.
- September’s dot plot now projects a 4.6% terminal FED Funds rate by 1Q23. This was higher than previously anticipated. Furthermore, no cuts are projected until 2024.
- SEPs – Summary of Economic Projection, filled out each meeting by individual FED members – shows the FED expects unemployment to rise from 3.7% to 4.4% over the next year simultaneous with slowing GDP. An increase of this magnitude often accompanies a secular-recession.
- No changes announced regarding balance sheet reduction.
Can You Trust The FED?
If there was any doubt you could fight the FED, then that was put to rest last week. While we can have rallies, all it took was a couple weeks of over-the-top hawkish talk to bring stocks back to their June lows. Zoom out a little. The FED began this tightening cycle around the beginning of the year. Looking at equity performance YTD, it’s clear: when the FED is your enemy, you cannot hope to win. However, who is to say you can trust the FED?
Last September, the FED only expected the terminal rate to be around 1% by the end of 2023 and continued to insist inflation was transitory. Clearly, we’re well past that. In other words, while I do not doubt the FED’s current intentions as laid out by this September’s meeting, I do doubt that it will come to fruition. In my opinion, their projected use of FED tools – balance sheet reduction and rate hikes – does not coincide with their economic projections. To be specific, if the FED continues to hike rates and reduce the balance sheet at this velocity, it will create an economy much worse than they have projected, which may warrant a change in policy from the current outline.
Alternatively, something could break, necessitating a change in policy. I am not calling for a pivot, but the FED’s stance and policy starkly changed from last September as they abandoned their stance on “transitory” overnight. The same could occur here if it becomes clear their consensus surrounding inflation, the strength of the economy, and the labor market is eroding or the pain proves too much to endure. Again, I am not calling for a pivot. I am only pointing out that the FED’s stance and policy direction can change rapidly, which means the broad direction of the stock market can as well.
The Week Ahead
There is not much to look forward to this week with respect to earnings, allowing FED speakers and economic releases to hog the limelight. Every day will feature one or more FED speakers. Powell speaks on Tuesday and Wednesday. Bullard speaks on Thursday alongside weekly initial and continuing jobless claims. Friday is the main event: August PCE.
Last month, Headline PCE was 6.3%; Core was 4.6%; both were MoM decreases. While I could not find a consensus estimate for Headline, consensus for Core is 4.7%, a 0.1% increase MoM. If we get a cool number, I expect markets can find some stability or make a little ground to the upside. If we get a hot number, the reaction will be telling. If we continue to drop, then the market had yet to fully price-in the sticky nature of inflation suggested by CPI. If markets stabilize or rise, then perhaps we’ve finished panicking over the nature of inflation as we currently know it.
Aside, the spread between the FED Funds Rate and the US2YR has only been this wide four other times in the last 50-years. While many have suggested that the US2YR is the “shadow-FED”, it is important to remember they are not actually one and the same. At this point, there is a compelling, data-backed argument that the US2YR will retreat to better align with FED Funds. Furthermore, broadly speaking from a technical perspective, stocks are currently oversold. Conditions are prime for a small, albeit short-lived, counter-trend lift in equities. To play the move directly, I have exposure to the SHY, an ETF that tracks the price performance of 1-3 Year U.S. Treasuries. Consequently, as the yield on the US2YR falls, the price of the SHY will increase.
What To Watch: The US10YR Yield
While the US2YR yield is not doing the market any favors, I think the US10YR yield is actually the most important for equities. In my opinion, stock prices were rather resilient as the yield on the US2YR broke out. It was only once the US10YR broke to new highs that we witnessed signs of panic – greater downside moves, VIX spikes, declining-advancing lines. In other words, when the market was only up against the US2YR, the market was willing to fight the FED. Once the US10YR joined the fray on the FED’s behalf, the market appeared less willing to get back into the ring.
The candlesticks track the US10YR’s yield. The blue line tracks the S&P500. This chart covers ~3m, starting with June’s low.
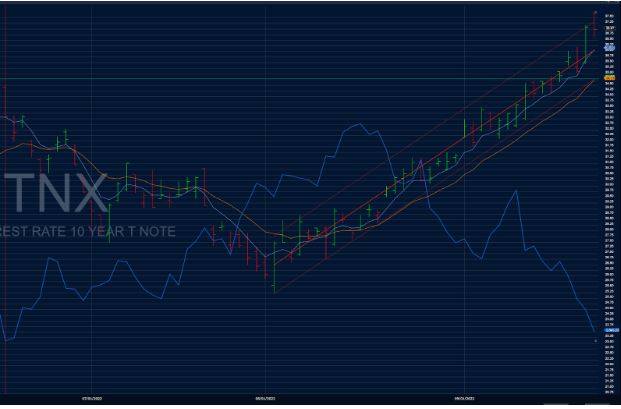
Over the last quarter, a strong case can be made for the US10YR as a primary trading indicator. If you had ignored all other signals in the market – earnings, economic reports, technical signals – and focused only on the US10YR, you would have done extremely well.
This strategy would have bought the S&P as the US10YR yield capitulated in mid-to-late June, a few sessions or so past the low. Then, it would have sold in mid-August once the US10YR broke above resistance: ~3%. The strategy missed the very top and the very bottom but did really well: it captured a meaningful gain, sold ahead of Jacksonhole, and avoided the false rally in early-September.
Of course, past performance is no indication of future results; correlation does not prove causation. However, given where markets are today, I think the US10YR still has this indicative power. The takeaway is that the US10YR yield can act as a lie detector for market rallies.
- Market rallies and the US10YR yield is rising, sell the rip.
- Market rallies and the US10YR yield is falling, buy the dip.
- Market rallies and the US10YR yield does nothing, do nothing.

Leave a Reply