
The Week Behind
All the major indices finished in the green, snapping multi-week losing streaks. The DOW finished up 2.66%; S&P up 3.65%; and the NASDAQ took the cake up 4.14%.
Highlights
- Despite lagging to start the week, the yield on the US2YR made new highs, closing ~3.56%, and the US10YR yield remained elevated, closing above 3.3%. Each suggests that the bond market believes the FED will execute on its current plans for rate hikes and balance sheet reduction.
- Similar to yields, oil started the week with a slide but rallied into the weekend to finish flat.
Contextualizing A Week In The Green
While it is a relief to see some green after three consecutive weeks of red, I think this is nothing more than a “relief rally” triggered by oversold conditions. In some respects, stocks were just as oversold to start last week as they were at June’s lows. For the S&P500, RSI, a momentum indicator used to evaluate oversold and overbought conditions, tells that story (green circles). Furthermore, fibonacci retracement suggests that as long as a downside move does not violate (or retrace) more than 61.8% of the upside move, the original trend can continue, which in this case has been positive since June’s low (purple lines).
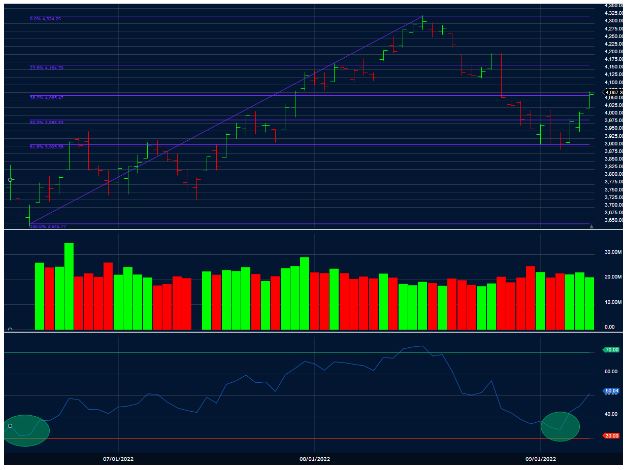
In summary, technical conditions were ripe for a bounce. I think we got it. I project it will continue this week. Stocks tend to have a bullish bias without FED speakers to remind them of the tightening ahead. In my view, with the FED in a blackout period until their meeting concludes on September 21st, stocks have until then to run.
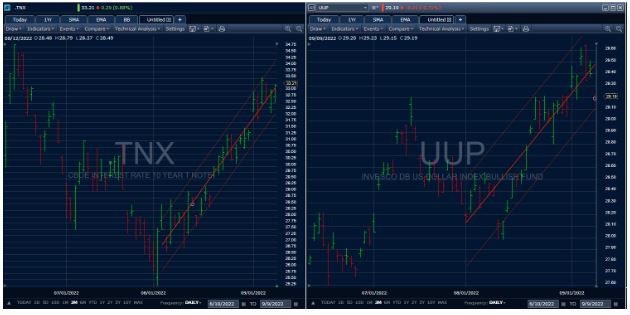
Under the hood, financial conditions remain tight via yields (TNX, US10YR) and the U.S. dollar has yet to show meaningful weakness (UUP). Both have been in uptrends since August 1st, coinciding with weakness in stocks. With the benefit of hindsight, we know these two factors, interest rates and the U.S. dollar, each a reflection of FED tightening, are the root causes for the current bear market. Unless these factors show some signs of reversal, it will be hard to convince me that any rally will be “the rally”.
Commodities, especially oil, deserve an honorable mention in their contribution to this bear market but have convincingly rolled over since peaking in June coincident with the market’s June bottom. Furthermore, the market was already in a downtrend before commodities became a focal point in late February. It is worth mentioning again now because softness in commodity prices remains a real variable that has improved since June, providing support from breaking below those lows.
I should acknowledge that the stock market, as a leading indicator, will likely rally ahead of any convincing reversal in yields or the dollar. So, there is still a chance this bounce becomes something more if yields retreat and/or the dollar weakens. By waiting for this reversal, you inevitably miss buying the very bottom but mitigate the probability of exposing new capital to another 20% drawdown. That being said, given where we are in the FED cycle and the state of economies outside the U.S., I do not expect either to convincingly reverse in the short-term. Assuming no black swans emerge, on the upside or downside, I maintain we are range bound between August’s highs and June’s lows.
The Week Ahead
August CPI releases Tuesday before the bell. It will dominate the conversation and price action this week. Consensus for Headline and Core are 8.1% and 6.1%, respectively. Last month, Headline was 8.5%; Core was 5.9%. With oil nearly flat for the year and down MoM, I think a cool number relative to 8.5% is probable. However, with housing comprising ~30% of CPI, I am not sure how close Headline gets to 8.1% or Core to 5.9 – 6.1%. However, with the FED in a blackout period, I sense the market will have a bullish bias and look for any reason to continue this technical rally, which I think will come in the form of a sub 8.5% Headline.
That being said, I am not sure CPI matters unless we get a hot number. A hot number would send stocks downward as we are currently priced for cooling inflation. While a cool CPI provides a little more upside clearance for bulls, I expect whatever additional upside is generated to evaporate the following week after the September meeting where I expect the FED will reiterate its hawkish stance. The FED needs “clear and convincing” evidence inflation is coming down through multiple reports over consecutive periods. CPI is one report. This would be the second consecutive report of declining inflation. It will not be enough to change the FED’s hawkish posture.
Earnings are light. Most people will be interested in Oracle (ORCL) and Adobe (ABDE): cloud companies integral to business digitization. Many argue that enterprise-spend on cloud and digitization are recession-resistant. These reports will provide additional evidence to support or undermine that thesis. These reports also provide a month of new data not covered by a majority of bellwether peers that reported a month earlier.
Price Is Truth
Simply put, “price is truth” implies that a stock’s or index’s price reflects a certain economic outcome. Investors and traders alike make decisions based on how their economic theses compare to the certain economic outcome currently priced-in. If you believe the current outcome reflected in the price is too pessimistic (too low), then you are a buyer; too optimistic (too high), a seller.
With respect to the S&P500, at ~4200, August highs, price reflected a FED Pivot triggered by a shallow recession catalyzed by tightening economic conditions. At ~3600, June lows, price reflected an uncertain economic environment plagued by untamed inflation that could only be defeated by inducing a crushing recession.
Understanding financial markets is both an art and a science. This “artistic”-leaning analysis provides another reference point for 3,900, the middle ground between binary economic outcomes, as a major battleground for equities. Above it, the bulls have the advantage; below it, the bears.

Leave a Reply